If we need more proof that the stock market is an autonomous system, look no further than a rally on the “Donroe Doctrine,” as some are calling it.
Happy New Year! We resume our coverage of US equity market structure, the mechanics of stocks.
I’m referring to the removal of the Venezuelan leader, for which both Democrat and Republican presidents had called and offered big bounties.
The clever doctrinal concatenation references the Monroe Doctrine done by Donald Trump. People my age learned it in high school, along with Teddy Roosevelt’s Big Stick (smile), geopolitics positing hegemony in the Americas in trade for commitment to stay out of Europe’s affairs.
No doubt energy opportunities are big.
But in Energy sector patterns – we track behaviors broadly, by sector, by industry, peer group, market capitalization and more – the only trend rising is speculative. A big year-end pattern of sector Passive selling ended Jan 2.
Before machines ran order flow, humans would look at geopolitical developments cautiously, even where opportunity might well be the net result.
Now it’s not just the humans but the machines that hallucinate. As investment rather than returns in AI has become a value driver, perception rather than reality gets the multiple. AI models and the humans creating them both can be irrationally exuberant.
We’ll see. The core question: What will the machines do with stocks this year?
For one, they’ve got more to do. The Investment Company Institute this week released ETF data for November 2025. We’ve topped 4,400 ETFs traded in the US market, versus less than 3,000 stocks accounting for about $78 trillion of market cap.
Of these ETFs, 2,400 are domestic-equity focused. The largest chunk, about 1,900, are broad-based, meaning built on market cap (and 90% of ETF assets are in large caps). It grew by more than 600 ETFs in 2025 (with a month’s data to go yet).
Sector ETFs increased from 447 to 475. There are 80 more international ETFs, now almost 900 total, on the boom in foreign global markets. More on that shortly.
Almost 900 bond ETFs, up 150 from a year ago. About 125 commodity ETFs, a hundred hybrids, up a combined ten new ETFs the past year.
All those instruments are kept aligned with stocks and derivatives like options and futures by swarms of whirling machines.
One result, the 50-day average number of daily trades in members of the S&P 500 is nearly 77,000. Trade size averages 82 shares. They trade 6.3mm shares per day, or over $1.4 billion in dollar volume each.
The average price of SPX components is about $227, the same as it was in December 2024, more than a year ago. It means that if you add up the prices of the components and denominate by roughly 500, price has barely budged in a year that broad measures smoked like rocket contrails.
How? Another story. Read what I wrote here. Concentration risk. I talked about it on the Schwab Network Monday.
Are the number of firms generating all this activity increasing? Nope. In fact, hedge funds have crept into the high-speed trading business, while high-speed firms have launched stock-picking funds.
Machines trade fewer things. And those things become the benchmark that outperforms its components by a mile. So what’s the benchmark for? Good question.
The answer to what machines will do is they will trade fewer things more frenetically, creating risk at the edges that what’s not getting traded by machines may lag.
Machines go where the money is. And that’s in large caps. It’s really the question to study, academics and mathematicians.
You’ve got machines trading ETFs, which have no intrinsic value and get prices through an arbitrage mechanism dependent on underlying stocks. You’ve got immense trading activity in those underlying stocks. You’ve got $1.5 trillion of notional daily value in zero-days-to-expiration options (alone, not counting weeklies, monthlies, quarterlies) on a narrow S&P 500 subset.
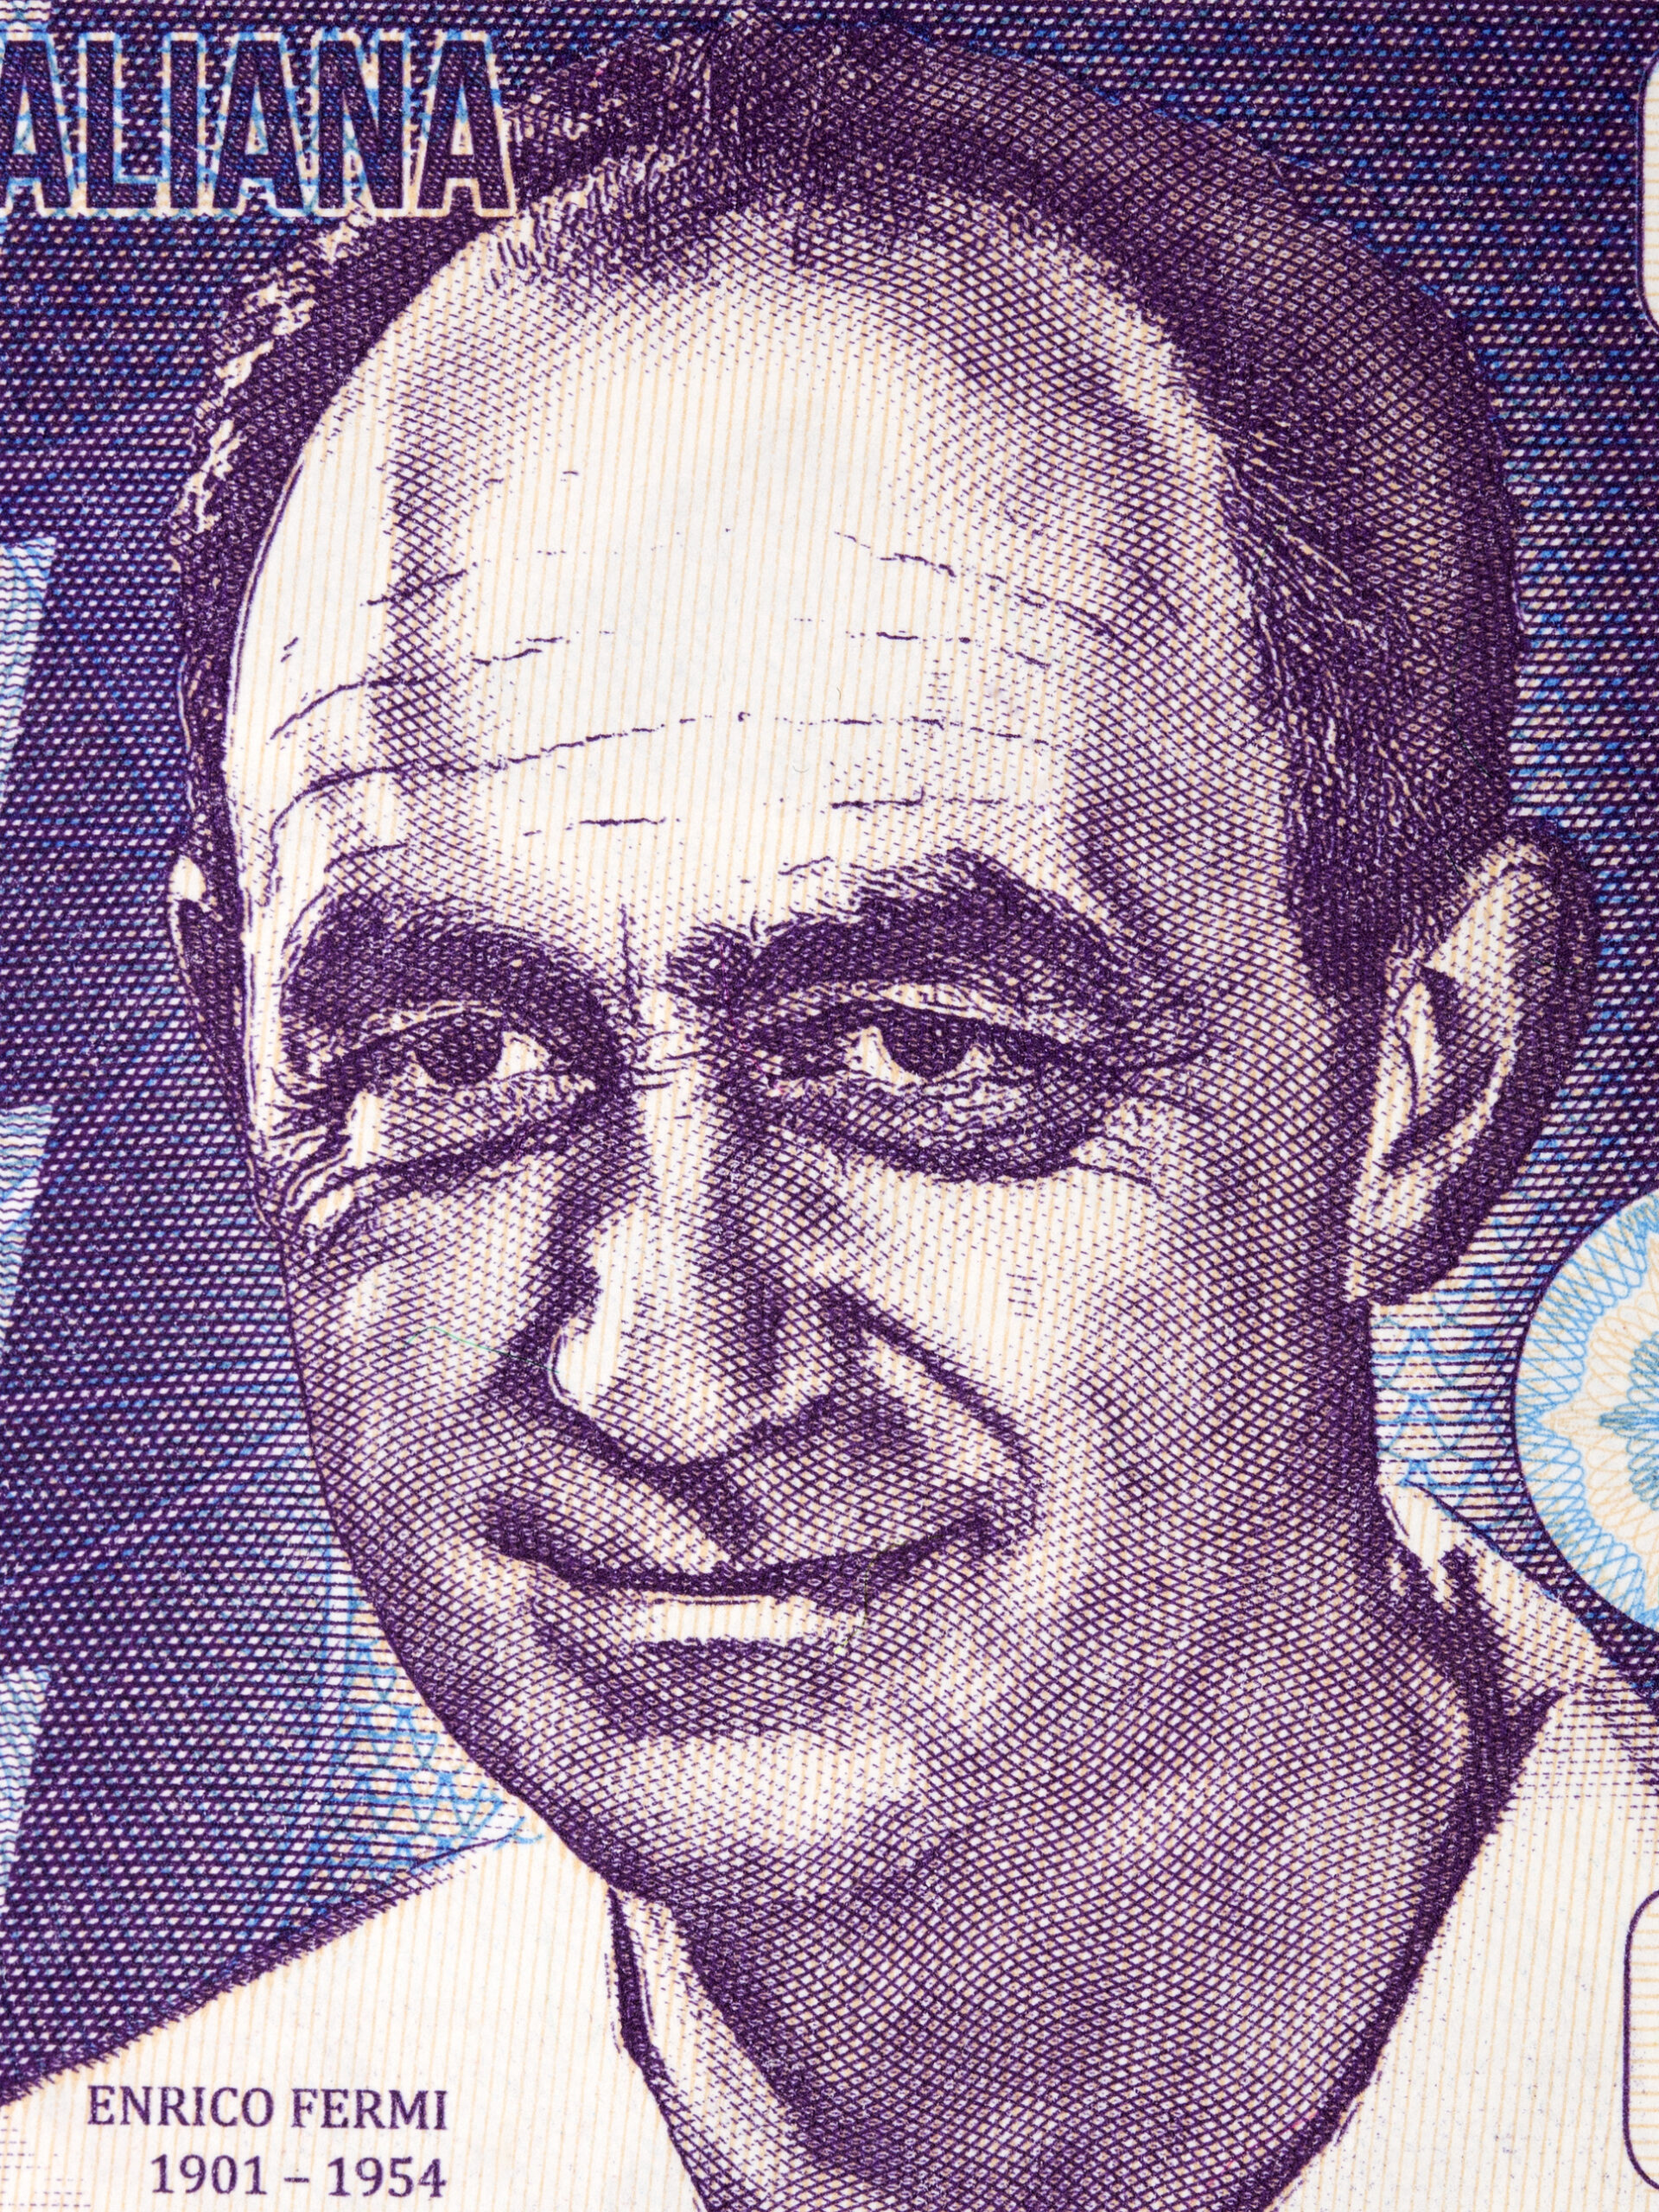
Is there a market structure version of the Fermi Paradox?
Physicist Enrico Fermi mused, “Where is everybody?” to explain the contradiction between the probability (high) and evidence (nil) of extraterrestrial life.
The Quast Paradox (cough, cough) is the colossal amount of activity dependent on the dozen trillion-dollar stocks supporting the entire stock market.
As to international markets, perspective matters. It’s been a fantastic year to own the DAX, the CAC, the FTSE 100, the Italian FTSE MIB, Spain’s IBEX index, Japan’s Nikkei.
But all of these markets were lower in 2020 than they were in 2000! This post describes that long view. The Nikkei only this year surpassed its 1990 high, by immolating the yen. Foreign markets rose mainly on the funeral pyres of currencies. I was in Sri Lanka in 1990 and 40 rupees bought a dollar. Today it’s 318.
That’s about the same exchange rate as the Venezuelan Bolivar.
It’s happened everywhere (including here). Stocks screaming up on free-falling purchasing power seems to me unsustainable. My old-school economic sensibilities can’t help it. Nor do I love relying on whirring machines trading the same things over and over.
But who knows? I’ve been wrong before.
What I do know is we can track all the money, all the time (and we can do that for issuers and investors). Doing so is what brought me to these realizations.