As stocks fell last week, pundits declared that interest rates and trade fears had shaken confidence. Yesterday as the Dow Jones Industrial Average zoomed 540 points, earnings, they declaimed, had brought investors rushing back. Oh, and easing trade tensions.
Didn’t we know corporate profits would be up 20% on tax cuts?
Rational factors affect stocks. But often these convenient explanations are offered afterward, and few observers seem to look at the data surrounding investment behavior.
The first image here with data from the Investment Company Institute’s 2018 Factbook shows the staggering shift from active to passive funds over the past decade. It debunks most market reporting claiming rational thought is reactively propelling markets.
A fallacy that lacks comprehension of how passive money behaves is that it rides the coattails of rational money (In fact Active investors are closet indexing with ETFs). If your stock is 1% of a weighted index fund, and shares rise faster than other components and become 1.2%, sooner or later the fund must rebalance or slip out of compliance.
If equities are meant to be 40% of a targ et-date fund and become 50%, the fund will rebalance. We see the patterns, most times at month-ends and quarter-ends, and around monthly expirations when options, futures, forwards, repurchases and other derivatives used widely by investors, market-makers and fund managers must be recalibrated.
The biggest culprit is Exchange Traded Funds.
We’re told by Blackrock, Vanguard and State Street that ETFs have little turnover. Should we believe money pours into markets but does nothing? It cannot simultaneously be true that trillions of dollars shift to ETFs and true that ETFs don’t invest it.
Unless ETFs don’t buy and sell things. In which case, what are ETFs?
I looked at the turnover rate in the last prospectus for SPY from State Street, the largest and oldest ETF. The fund says it bought or sold just 3% of its $242 billion of assets.
But turnover is footnoted: “Portfolio turnover rate excludes securities received or delivered from in-kind processing of creations or redemptions of units.”
Huh. Creations and redemptions? We researched it (as you already know!).
Creations and redemptions, it turns out, are tax-free, commission-free, off-market block transactions between large brokers and ETF creators like Blackrock. The broker supplies collateral such as stocks or cash and receives in-kind rights to create and sell ETF shares.
Then trillions of investment dollars buy these collateralized stock substitutes, setting stocks afire. If investors sell ETFs, brokers buy and return them to Blackrock to get collateral back. Wash, rinse, repeat.
Blackrock makes money as the rush of investors into ETFs drives up the value of the underlying collateral (gotten by brokers where?), and by minimizing taxes.
For instance, under rules for ETFs, if your stock has gone way up, Blackrock will put your shares in the redemption basket to trade for an equal value of ETF shares from, say, Morgan Stanley, which then can sell and short your stock, which plunges.
Blackrock sheds associated capital gains. Morgan Stanley at some future point will cover or buy your shares and return them to Blackrock for the right to create more ETF shares offering exposure to – whatever, the S&P 500, a sector ETF, a market-cap ETF.
These transactions are occurring in the hundreds of billions of dollars monthly, none of it recorded as fund turnover.
If creations and redemptions were counted for SPY, its turnover rate would be 165%, not 3%. SPY created and redeemed well more than $400 billion, nearly double its total assets, in the most recent full year.
As of Aug 2018, nearly $2.9 TRILLION of these transactions has occurred – all effectively commission-free and tax-free for Blackrock, Vanguard and State Street (but not for the end consumers of ETFs, who pay taxes and commissions).
Continually, brokers try to profit on differing prices for collateral and ETF shares, and ETF managers try to wash out capital gains, removing overvalued collateral and bringing in undervalued collateral (the reason you and peers diverge).
The relentless creation/redemption tides swing stocks, and human beings then cast about for explanations like interest rates or trade fears – or wait, trade fears have eased! The market rallies!
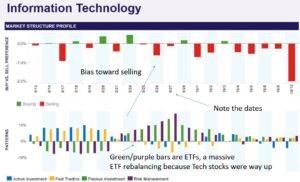
 This is what it looks like in the Tech sector. We saw the same pattern at the same time in every GICS sector to varying degrees, the most in Materials (down 10%), the least in Utilities (down less than 2% the past five days).
The last time the market rebalanced was in early July, the first part of the third quarter of 2018. Our Sentiment Index dipped below 4.0, a market bottom. We observed no meaningful rebalancing again in July, or August, or September. Each time the market mean-reverted to 5.0 without turning negative, we warned of compounding imbalances.
Market Sentiment was about 4.0, a bottom, Oct 15, after topping Sep 26. Into expirations today through Friday, we expected a strong surge because all the stuff that was overweight is now underweight (the surge arrived a day early, before VIX expirations).
These cycles tend to shorten as markets break down. We had six bottoms in 2015, the last time the market was negative for the year. This is the third for 2018 after just one in 2017. Aging bull market?


